
United States Electric Pick-up Trucks Market Size and Share
Market Overview
| Study Period | 2019 - 2031 |
|---|---|
| Forecast Data Period | 2026 - 2031 |
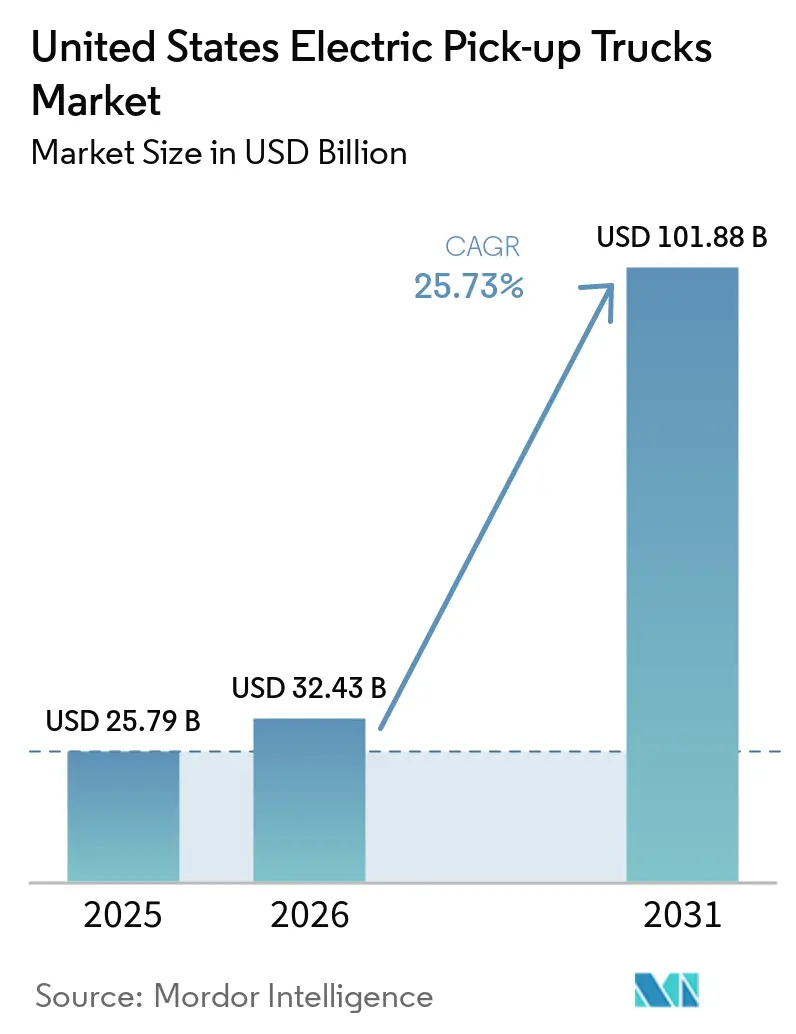
| Base Year Market Size (2025) | USD 25.79 Billion |
| Market Size (2026) | USD 32.43 Billion |
| Market Size (2031) | USD 101.88 Billion |
| Growth Rate (2026 - 2031) | 25.73% CAGR |
| Market Concentration | Low |
Major Players
*Disclaimer: Major Players sorted in no particular order Image © ����������. Reuse requires attribution under CC BY 4.0. |
|
United States Electric Pick-up Trucks Market Analysis by ����������
The United States electric pick-up trucks market size was valued at USD 25.79 billion in 2025 and estimated to grow from USD 32.43 billion in 2026 to reach USD 101.88 billion by 2031, at a CAGR of 25.73% during the forecast period (2026-2031). Market expansion reflects rapid declines in lithium-ion battery costs, a layered mix of federal and state policy incentives, and the entry of multiple new vehicle programs that are broadening buyer choice. Manufacturers are shifting product strategies toward architectures that temper cost while preserving truck-level utility, and digital sales models are compressing time-to-market for emerging brands. Infrastructure rollouts along priority freight corridors are beginning to mitigate range-anxiety concerns for long-distance operators, while data-rich software platforms improve fleet utilization and residual values. Competitive focus is moving from hardware differentiation to energy-service ecosystems in which the vehicle, battery, and charging network operate as an integrated value stack.
Key Report Takeaways
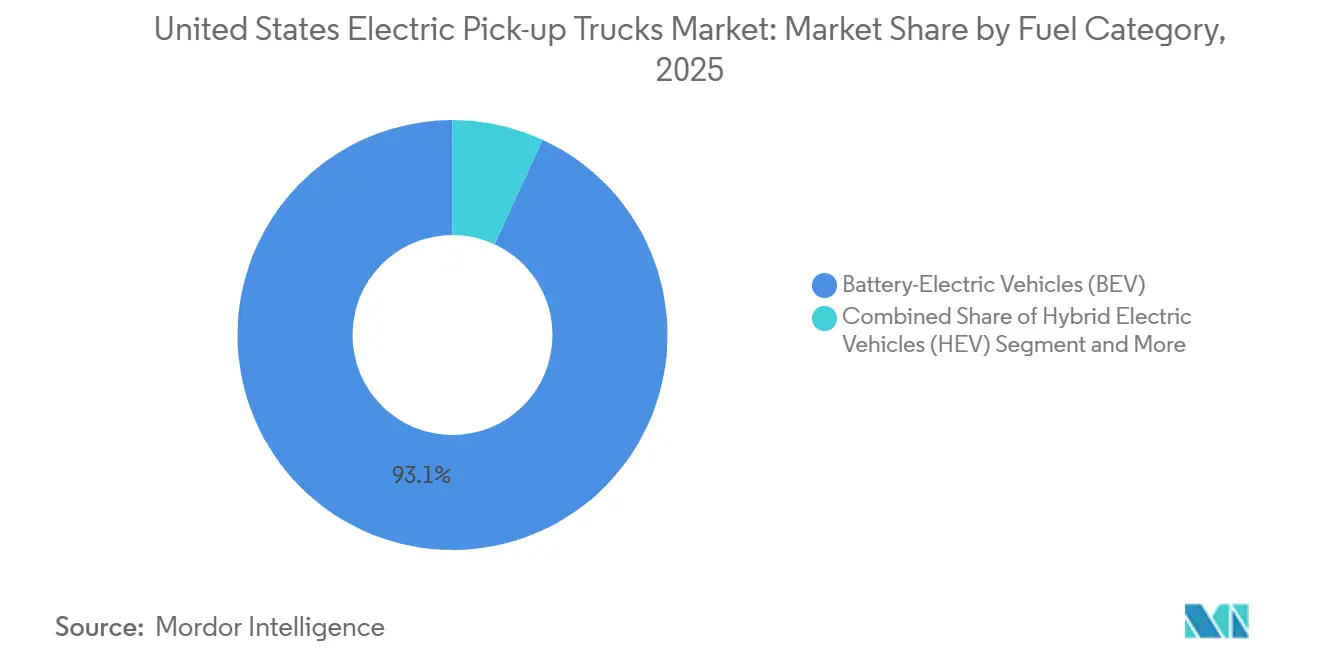
- By fuel category, battery-electric vehicles led with 93.12% share of the United States electric pick-up trucks market in 2025 and are set to record the highest projected CAGR at 31.33% through 2031.
- By vehicle class, the Class 2b and 3 (6 001–14 000 lbs GVWR) segment held 61.74% of the United States electric pick-up trucks market share in 2025, while the Class 1 and 2a (Below 6 000 lbs GVWR) class is forecasted to expand at 26.04% CAGR through 2031.
- By battery capacity, 100-150 kWh packs accounted for 47.57% of the United States electric pick-up truck market in 2025, and packs above 150 kWh are advancing at a 32.92% CAGR to 2031.
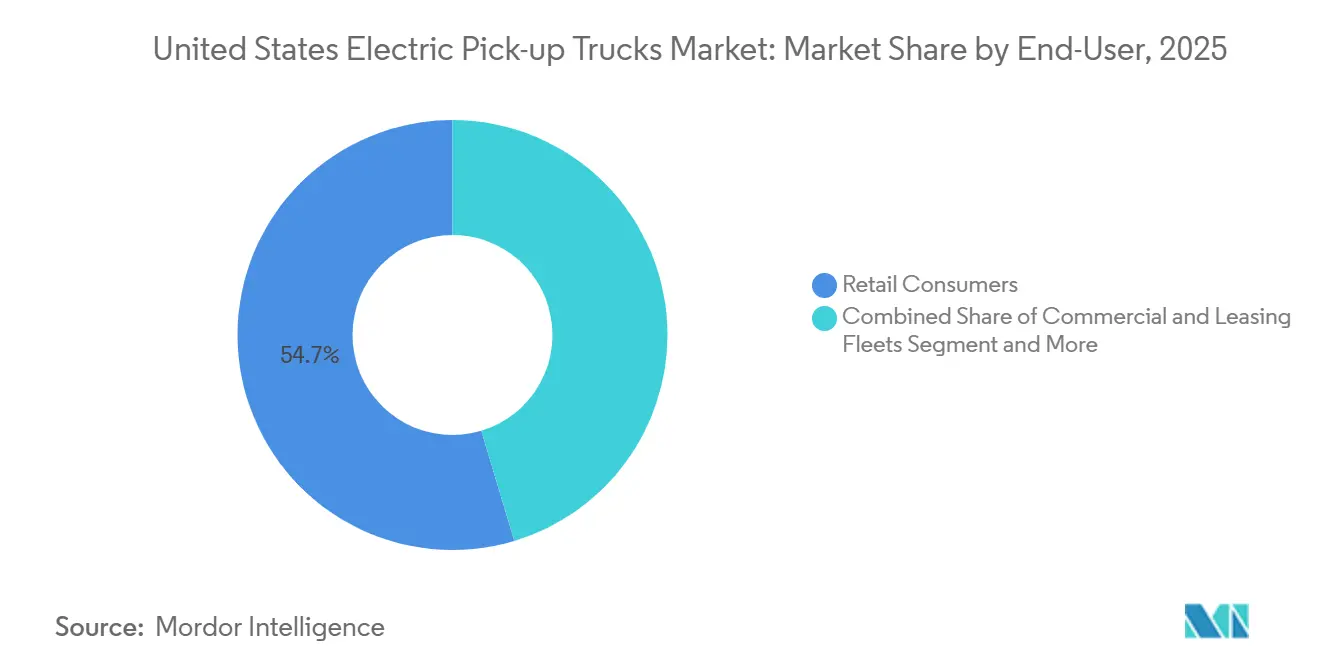
- By end-user, retail buyers represented 54.65% of demand in 2025; commercial and leasing fleets show the fastest CAGR at 29.43% over the forecast period.
- By sales channel, franchise dealerships held 63.76% share of the United States electric pick-up trucks market in 2025, whereas direct-to-consumer models are set to grow at 31.13% CAGR to 2031.
- By state, California held 18.22% share of the 2025 market size, while Texas is set to register a 29.91% CAGR to 2031.
Note: Market size and forecast figures in this report are generated using ����������’s proprietary estimation framework, updated with the latest available data and insights as of 2026.
United States Electric Pick-up Trucks Market Trends and Insights
Drivers Impact Analysis*
| Driver | (~)% Impact on CAGR Forecast | Geographic Relevance | Impact Timeline |
|---|---|---|---|
| Falling Battery-Pack Costs | +4.2% | National, with early gains in California, Texas, Michigan | Medium term (2-4 years) |
| Federal & State Purchase Incentives | +3.8% | National (federal); California, Colorado, Massachusetts, New York (state) | Short term (≤ 2 years) |
| Corporate Fleet Decarbonization Mandates | +3.5% | National, concentrated in California, Washington, Northeast states | Medium term (2-4 years) |
| Domestic Battery-Cell Manufacturing Expansion | +3.4% | Michigan, Tennessee, Kentucky, Georgia | Long term (≥ 4 years) |
| Bi-directional Charging Revenue Streams | +2.3% | California, Texas, Colorado (utility pilot markets) | Long term (≥ 4 years) |
| High Residual-Value Expectation | +2.1% | California, Texas, Florida, Washington | Medium term (2-4 years) |
| Source: ���������� | |||
Falling Battery-Pack Costs
Pack prices continued to slide as domestic gigafactories scaled and material substitution reduced cathode expense. The U.S. Department of Energy projects that cost reductions will narrow the purchase-price gap between battery-electric and gasoline trucks well before mid-decade[1]“2025 Incremental Purchase Cost Methodology and Results for Clean Vehicles,” U.S. Department of Energy, energy.gov. Automakers are realigning model portfolios around chemistries that balance range and affordability. Lower pack costs translate into shorter total-cost-of-ownership payback periods, a metric closely tracked by commercial fleets. Reduced capital risk is prompting finance providers to introduce longer-tenor leases, further smoothing the transition. As a result, price sensitivity, once the dominant barrier, is easing for both retail and fleet buyers.
Federal & State Purchase Incentives
Although the federal clean-vehicle credit expired in September 2025[2]"Electric vehicle incentives face dramatic termination under new legislation", Instead, instead.com, a patchwork of state rebates and point-of-sale tax relief continues to cushion upfront pricing. The ZEV mandate links these incentives to compliance targets, aligning consumer benefits with manufacturers' obligations. Transitional policies concentrate demand into high-population corridors, giving OEMs a predictable launchpad for early volumes. At the same time, procurement programs for public-sector fleets help backstop residual values, lowering lender exposure. Incentive stacks, therefore, act as both demand accelerant and risk-mitigation tool, reinforcing the business case for expanded production.
Corporate Fleet Decarbonization Mandates
Large shippers are embedding zero-emission targets into supplier scorecards, effectively hard-coding the adoption of electric pick-ups into fleet replacement cycles. Centralized depots simplify overnight charging and create revenue opportunities through demand-response participation. Operational data from early adopters highlight maintenance cost savings and improved driver retention, building a feedback loop that encourages peer fleets to follow suit. When combined with falling energy costs, these mandates convert sustainability goals into tangible margin improvements. The resulting fleet pull is reshaping order books in favor of high-utilization, high-battery-capacity models.
Domestic Battery-Cell Manufacturing Expansion
Production-tax credits have catalyzed multi-billion-dollar cell plants across the Battery Belt. Localized supply decreases logistics expense, shortens lead times, and enhances quality assurance. Regional clusters spur ancillary investment in materials processing and recycling, further lowering lifecycle emissions. Over the long term, domestic content thresholds embedded in consumer incentives incentivize OEMs to source locally, locking in offtake agreements with new cell producers. The geographic co-location of cell and vehicle plants is already visible in Michigan and Tennessee, pointing to a durable structural advantage for U.S. manufacturing.
Restraints Impact Analysis*
| Restraint | (~)% Impact on CAGR Forecast | Geographic Relevance | Impact Timeline |
|---|---|---|---|
| High Vehicle Price Differential | -3.2% | National, acute in non-incentive states | Short term (≤ 2 years) |
| Sparse Fast-Charging Coverage | -2.8% | Rural Midwest, Mountain West, Southern states | Medium term (2-4 years) |
| Range Degradation | -1.4% | National, especially long-distance towing corridors | Medium term (2-4 years) |
| Dealer Service-Network Gaps | -1.2% | Rural and small metro areas nationwide | Long term (≥ 4 years) |
| Source: ���������� | |||
High Up-front Vehicle Price Differential
The sticker premium over comparable gasoline trucks still weighs on mass-market adoption. With the federal incentive expired, affordability hinges on state programs, OEM leasing strategies, and secondary-market confidence. Financing innovations such as battery-subscription models are emerging, yet their penetration remains limited. Buyers without home charging access also face additional installation costs, creating a compounded hurdle. Until scale economies shave more capital out of the battery, higher entry prices will temper the speed of uptake in price-sensitive regions.
Sparse Rural DC Fast-Charging Coverage
Long-distance towing or work-site assignments often traverse charging deserts. The National Zero-Emission Freight Corridor Strategy maps a phased build-out that leaves many rural highways until its final stage in the next decade. While automaker alliances with existing networks are improving interoperability, true parity with gasoline refueling density remains distant. The constraint is most acute for owner-operators whose routes vary seasonally. Slow progress here caps the practical addressable market in the near and medium term.
*Our forecasts treat driver/restraint impacts as directional, not additive. The impact forecasts reflect baseline growth, mix effects, and variable interactions.
Segment Analysis
By Fuel Category: Battery-Electric Dominance Accelerates
Battery-electric trucks captured 93.12% of the United States electric pick-up trucks market in 2025 and are expected to register a CAGR of 31.33% to 2031, reflecting a decisive lead over hybrid alternatives. Product plans from leading OEMs emphasize larger packs and faster charging, signaling confidence in continued share gains. Greater drivetrain simplicity is lowering service costs, which, in turn, strengthens residual values and lease attractiveness. Software-enabled torque management gives battery-electric models a performance edge that resonates with both recreational and commercial users.
Plug-in and range-extended hybrids remain relevant in regions where charging access is thin, yet their advantage narrows as infrastructure spreads. Brands experimenting with on-board generators pitch extreme-range capability, but market reception hinges on pricing relative to pure battery-electric configurations. Should battery production outpace projections, hybrids may cede even more ground. In parallel, policy frameworks continue to favor zero-tailpipe-emission solutions, creating systemic pressure that aligns with buyer trends.


By Vehicle Class: Commercial Fleets Drive Heavy-Class Adoption
The 6,001-14,000 lbs segment held 61.74% of the United States electric pick-up trucks market share in 2025, underscoring strong demand from trade, utility, and delivery fleets. Payload capacity and exportable power features meet work-site requirements, making this class the default choice for institutional buyers. Fleet duty cycles also match high-battery utilization profiles, maximizing return on the electrified drivetrain investment.
Conversely, lighter classes are on a faster growth curve, posting a 26.04% CAGR outlook as lifestyle buyers embrace electric trucks for commuting and recreation. Automakers are tailoring these models with sport-oriented trims and digital-first purchase journeys. As battery density improves, lighter trucks will inherit range previously reserved for heavier models, further broadening audience reach. Over time, cross-shopping with mid-size SUVs is likely to raise competitive stakes in the segment.
By Battery Capacity: Extended-Range Packs Gain Share
Battery systems with 100-150 kWh of capacity captured 47.57% of the market share in 2025, solidifying this capacity band as the segment benchmark. The size balances cost, curb weight, and usable range, satisfying the majority of daily driving and job-site demands. Automakers optimize thermal management and cell chemistry at this sweet spot, resulting in consistent real-world performance. Financing products are also calibrated around this pack size, giving buyers clear monthly-payment expectations. Collectively, these elements reinforce the band’s primacy in both retail and fleet ordering patterns.
Packs exceeding 150 kWh are forecast to grow at a 32.92% CAGR through 2031, outpacing all other capacity brackets. Customers who tow heavy loads or operate in remote regions value the added endurance that bigger packs provide. Manufacturers position the larger batteries as premium upgrades bundled with faster charging and bidirectional power features, creating differentiated revenue streams. As cell prices fall, the cost step-up narrows, making the upgrade decision easier for buyers seeking a future-proof range. This momentum suggests that extended-range configurations will graduate from niche status to mainstream option sets.
By End-User: Fleet Electrification Outpaces Retail
Retail buyers held 54.65% market share in 2025, underscoring strong individual enthusiasm for electric trucks. Early adopters laud instant torque, quiet cabins, and the novelty of software-defined personalization. Influencer content and community events amplify these attributes, creating intangible lifestyle appeal that gasoline trucks seldom match. Dealer test-drive programs target this audience with weekend adventure showcases, further cementing interest. The result is a robust baseline of household demand that anchors production planning.
Commercial and leasing fleets are expected to post a 29.43% CAGR through 2031, the highest among end-user segments. Corporate sustainability targets, coupled with total-cost-of-ownership savings, make electric pick-ups attractive for high-utilization duty cycles. Centralized depot charging simplifies energy management, while telematics suites optimize routing and maintenance scheduling. Utilities increasingly remunerate vehicle-to-grid participation, adding an income stream that enhances fleet payback. These factors combine to propel fleet electrification at a pace that will steadily tilt the overall mix toward institutional buyers.
By Sales Channel: Direct-to-Consumer Models Challenge Franchises
Franchise dealerships controlled 63.76% of the sales in 2025, benefiting from entrenched service networks and established financing partners. Showrooms showcase charging demonstrations and hands-on towing tests, experiences that purely online portals find hard to replicate. Dealer participation in state incentive paperwork also removes friction from the buying process. Certified technicians reassure customers about battery longevity and high-voltage safety, underpinning trust. Taken together, these functions keep the franchise channel firmly in the lead for now.
Direct-to-consumer and online platforms, however, are poised to expand at a 31.13% CAGR through 2031, the fastest among sales channels. Transparent pricing, remote signatures, and doorstep delivery resonate with digital-first consumers. Automakers leverage data insights from these channels to refine product cycles and push over-the-air updates that deepen brand engagement. Subscription-style ownership models, featuring bundled maintenance and insurance, flourish in this environment. As regulatory landscapes evolve to accommodate agency retail, the direct model’s share is set to climb steadily across the decade.
Competitive Landscape
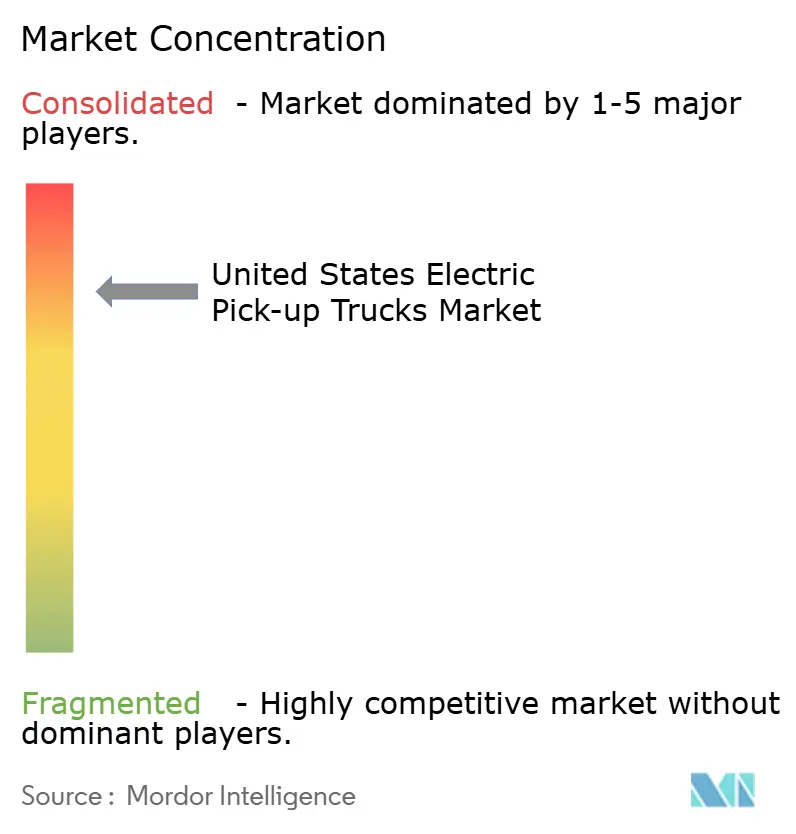
The market shows a high level of concentration, indicating that the five leading brands hold a commanding position. Ford’s decision to shift its next-generation F-150 Lightning to an extended-range architecture underscores a willingness to diverge from pure battery-electric orthodoxy in pursuit of towing credibility. General Motors is centralizing electric-truck assembly at its Detroit flagship to capture learning-curve benefits and expedite software updates across sister models[3]Francesco Armenio, "General Motors is rethinking its EV push, and the implications are serious," ClubAlfa Global, www.clubalfa.it.
Rivian’s brand equity in adventure-oriented design yields high preorder conversion, yet the firm must scale manufacturing efficiency to challenge volume leaders. Direct-to-consumer pioneers rely on vertically integrated software stacks to differentiate and position post-sale digital services as a recurring revenue source. Legacy automakers, in response, are embedding connected-vehicle architectures that enable feature unlocks, fleet telematics, and energy-service integration.
Strategic investment in domestic battery supply is a unifying theme. Joint ventures up and down the value chain pair automakers with cell specialists to secure long-term offtake and accelerate chemistry innovation. As cost curves flatten, the theater of competition is likely to migrate toward charging-network access, bi-directional energy services, and over-the-air customization, areas where first-mover experience can yield durable network effects.
United States Electric Pick-up Trucks Industry Leaders
-
Ford Motor Company
-
General Motors Company
-
Rivian Automotive Inc.
-
Stellantis N.V.
-
Tesla, Inc.
- *Disclaimer: Major Players sorted in no particular order

Geography Analysis
California retained 18.22% share of the United States electric pick-up trucks market in 2025, anchored by stringent zero-emission mandates, dense public charging, and a robust early-adopter culture. State rebates further narrow effective purchase prices, and utility programs subsidize residential charger installations. These factors combine to secure California’s position as the primary testbed for new model launches and over-the-air software features.
Attention is now turning to Texas, projected to grow at 29.91% CAGR through 2031. Competitive electricity tariffs, a large fleet base in the energy sector, and an expanding fast-charge corridor along Interstate 35 underpin the state’s surge. Local governments are partnering with private operators to create megawatt-scale charging depots to meet long-haul towing needs, addressing a longstanding pain point for truck buyers.
Beyond the two headline states, adoption patterns fragment along infrastructure and policy lines. Pacific Northwest markets benefit from high renewable energy penetration, further enhancing the emissions advantage of electric pick-ups. Mountain West states exhibit pockets of rapid growth where utility incentives align with tourism-driven light-duty fleet renewal. Conversely, portions of the rural Midwest remain constrained by sparse charging coverage, prolonging dependence on plug-in hybrids and range-extended models.
Recent Industry Developments
- February 2026: Ford confirmed plans for a compact electric pick-up around the USD 30,000 price point, targeting a 2027 launch on its Universal EV platform.
- April 2025: Kia disclosed development of an electric pick-up for North America as part of its multi-model EV rollout scheduled through 2030.
- April 2025: Start-up Slate Auto emerged from stealth, unveiling a sub-USD 25,000 compact electric truck aimed at entry-level buyers.


United States Electric Pick-up Trucks Market Report Scope
The United States Electric Pick-up Trucks market is analyzed across fuel type, vehicle class, battery capacity, end-user, and state. By Fuel Category, the market is segmented into Battery-Electric, Hybrid Electric, and Plug-in Hybrid Electric. By Vehicle Class, the market is segmented into Class 1 & 2a and Class 2b & 3. By Battery Capacity (kWh), the market is segmented into Below 100 kWh, 100 to 150 kWh, and Over 150 kWh. By End-User, the market is segmented into Retail Consumers, Commercial & Leasing Fleets, and Government & Utilities. By Sales Channel, the market is segmented into Franchise Dealers and Direct-to-Consumer. By State, the market is segmented into Alabama, Alaska, Arizona, Arkansas, California, Colorado, Connecticut, Delaware, Florida, Georgia, Hawaii, Idaho, Illinois, Indiana, Iowa, Kansas, Kentucky, Louisiana, Maine, Maryland, Massachusetts, Michigan, Minnesota, Mississippi, Missouri, Montana, Nebraska, Nevada, New Hampshire, New Jersey, New Mexico, New York, North Carolina, North Dakota, Ohio, Oklahoma, Oregon, Pennsylvania, Rhode Island, South Carolina, South Dakota, Tennessee, Texas, Utah, Vermont, Virginia, Washington, West Virginia, Wisconsin, and Wyoming. Market forecasts are provided in terms of Value (USD) and Volume (Units).
| Battery-Electric Vehicles (BEV) |
| Hybrid Electric Vehicles (HEV) |
| Plug-in Hybrid Electric Vehicles (PHEV) |
| Class 1 and 2a (Below 6,000 lbs GVWR) |
| Class 2b and 3 (6,001 to 14,000 lbs GVWR) |
| Below 100 kWh |
| 100 to 150 kWh |
| Over 150 kWh |
| Retail Consumers |
| Commercial and Leasing Fleets |
| Government and Utilities |
| Franchise Dealerships |
| Direct-to-Consumer (DTC) / Online |
| Alabama |
| Alaska |
| Arizona |
| Arkansas |
| California |
| Colorado |
| Connecticut |
| Delaware |
| Florida |
| Georgia |
| Hawaii |
| Idaho |
| Illinois |
| Indiana |
| Iowa |
| Kansas |
| Kentucky |
| Louisiana |
| Maine |
| Maryland |
| Massachusetts |
| Michigan |
| Minnesota |
| Mississippi |
| Missouri |
| Montana |
| Nebraska |
| Nevada |
| New Hampshire |
| New Jersey |
| New Mexico |
| New York |
| North Carolina |
| North Dakota |
| Ohio |
| Oklahoma |
| Oregon |
| Pennsylvania |
| Rhode Island |
| South Carolina |
| South Dakota |
| Tennessee |
| Texas |
| Utah |
| Vermont |
| Virginia |
| Washington |
| West Virginia |
| Wisconsin |
| Wyoming |
| By Fuel Category | Battery-Electric Vehicles (BEV) |
| Hybrid Electric Vehicles (HEV) | |
| Plug-in Hybrid Electric Vehicles (PHEV) | |
| By Vehicle Class | Class 1 and 2a (Below 6,000 lbs GVWR) |
| Class 2b and 3 (6,001 to 14,000 lbs GVWR) | |
| By Battery Capacity (kWh) | Below 100 kWh |
| 100 to 150 kWh | |
| Over 150 kWh | |
| By End-User | Retail Consumers |
| Commercial and Leasing Fleets | |
| Government and Utilities | |
| By Sales Channel | Franchise Dealerships |
| Direct-to-Consumer (DTC) / Online | |
| By State | Alabama |
| Alaska | |
| Arizona | |
| Arkansas | |
| California | |
| Colorado | |
| Connecticut | |
| Delaware | |
| Florida | |
| Georgia | |
| Hawaii | |
| Idaho | |
| Illinois | |
| Indiana | |
| Iowa | |
| Kansas | |
| Kentucky | |
| Louisiana | |
| Maine | |
| Maryland | |
| Massachusetts | |
| Michigan | |
| Minnesota | |
| Mississippi | |
| Missouri | |
| Montana | |
| Nebraska | |
| Nevada | |
| New Hampshire | |
| New Jersey | |
| New Mexico | |
| New York | |
| North Carolina | |
| North Dakota | |
| Ohio | |
| Oklahoma | |
| Oregon | |
| Pennsylvania | |
| Rhode Island | |
| South Carolina | |
| South Dakota | |
| Tennessee | |
| Texas | |
| Utah | |
| Vermont | |
| Virginia | |
| Washington | |
| West Virginia | |
| Wisconsin | |
| Wyoming |


Market Definition
- Vehicle Type - The category includes Light Commercial Vehicle.
- Vehicle Body Type - This include Light Commercial Pick-up Trucks category.
- Fuel Category - The category exclusively covers electric propulsion systems, including various types such as HEV (Hybrid Electric Vehicles), PHEV (Plug-in Hybrid Electric Vehicles), BEV (Battery Electric Vehicles), and FCEV (Fuel Cell Electric Vehicles).
| Keyword | Definition |
|---|---|
| Electric Vehicle (EV) | A vehicle which uses one or more electric motors for propulsion. Includes cars, buses, and trucks. This term includes all-electric vehicles or battery electric vehicles and plug-in hybrid electric vehicles. |
| BEV | A BEV relies completely on a battery and a motor for propulsion. The battery in the vehicle must be charged by plugging it into an outlet or public charging station. BEVs do not have an ICE and hence are pollution-free. They have a low cost of operation and reduced engine noise as compared to conventional fuel engines. However, they have a shorter range and higher prices than their equivalent gasoline models. |
| PEV | A plug-in electric vehicle is an electric vehicle that can be externally charged and generally includes all-electric vehicles as well as plug-in hybrids. |
| Plug-in Hybrid EV | A vehicle that can be powered either by an ICE or an electric motor. In contrast to normal hybrid EVs, they can be charged externally. |
| Internal combustion engine | An engine in which the burning of fuels occurs in a confined space called a combustion chamber. Usually run with gasoline/petrol or diesel. |
| Hybrid EV | A vehicle powered by an ICE in combination with one or more electric motors that use energy stored in batteries. These are continually recharged with power from the ICE and regenerative braking. |
| Commercial Vehicles | Commercial vehicles are motorized road vehicles designed for transporting people or goods. The category includes light commercial vehicles (LCVs) and medium and heavy-duty vehicles (M&HCV). |
| Passenger Vehicles | Passenger cars are electric motor– or engine-driven vehicles with at least four wheels. These vehicles are used for the transport of passengers and comprise no more than eight seats in addition to the driver’s seat. |
| Light Commercial Vehicles | Commercial vehicles that weigh less than 6,000 lb (Class 1) and in the range of 6,001–10,000 lb (Class 2) are covered under this category. |
| M&HDT | Commercial vehicles that weigh in the range of 10,001–14,000 lb (Class 3), 14,001–16,000 lb (Class 4), 16,001–19,500 lb (Class 5), 19,501–26,000 lb (Class 6), 26,001–33,000 lb (Class 7) and above 33,001 lb (Class 8) are covered under this category. |
| Bus | A mode of transportation that typically refers to a large vehicle designed to carry passengers over long distances. This includes transit bus, school bus, shuttle bus, and trolleybuses. |
| Diesel | It includes vehicles that use diesel as their primary fuel. A diesel engine vehicle have a compression-ignited injection system rather than the spark-ignited system used by most gasoline vehicles. In such vehicles, fuel is injected into the combustion chamber and ignited by the high temperature achieved when gas is greatly compressed. |
| Gasoline | It includes vehicles that use gas/petrol as their primary fuel. A gasoline car typically uses a spark-ignited internal combustion engine. In such vehicles, fuel is injected into either the intake manifold or the combustion chamber, where it is combined with air, and the air/fuel mixture is ignited by the spark from a spark plug. |
| LPG | It includes vehicles that use LPG as their primary fuel. Both dedicated and bi-fuel LPG vehicles are considered under the scope of the study. |
| CNG | It includes vehicles that use CNG as their primary fuel. These are vehicles that operate like gasoline-powered vehicles with spark-ignited internal combustion engines. |
| HEV | All the electric vehicles that use batteries and an internal combustion engine (ICE) as their primary source for propulsion are considered under this category. HEVs generally use a diesel-electric powertrain and are also known as hybrid diesel-electric vehicles. An HEV converts the vehicle momentum (kinetic energy) into electricity that recharges the battery when the vehicle slows down or stops. The battery of HEV cannot be charged using plug-in devices. |
| PHEV | PHEVs are powered by a battery as well as an ICE. The battery can be charged through either regenerative breaking using the ICE or by plugging into some external charging source. PHEVs have a better range than BEVs but are comparatively less eco-friendly. |
| Hatchback | These are compact-sized cars with a hatch-type door provided at the rear end. |
| Sedan | These are usually two- or four-door passenger cars, with a separate area provided at the rear end for luggage. |
| SUV | Popularly known as SUVs, these cars come with four-wheel drive, and usually have high ground clearance. These cars can also be used as off-road vehicles. |
| MPV | These are multi-purpose vehicles (also called minivans) designed to carry a larger number of passengers. They carry between five and seven people and have room for luggage too. They are usually taller than the average family saloon car, to provide greater headroom and ease of access, and they are usually front-wheel drive. |


Research Methodology
���������� follows a four-step methodology in all its reports.
- Step-1: Identify Key Variables: To build a robust forecasting methodology, the variables and factors identified in Step-1 are tested against available historical market numbers. Through an iterative process, the variables required for market forecast are set and the model is built based on these variables.
- Step-2: Build a Market Model: Market-size estimations for the historical and forecast years have been provided in revenue and volume terms. Market revenue is calculated by multiplying the sales volume with their respective average selling price (ASP). While estimating ASP factors like average inflation, market demand shift, manufacturing cost, technological advancement, and varying consumer preference, among others have been taken into account.
- Step-3: Validate and Finalize: In this important step, all market numbers, variables, and analyst calls are validated through an extensive network of primary research experts from the market studied. The respondents are selected across levels and functions to generate a holistic picture of the market studied.
- Step-4: Research Outputs: Syndicated ����������, Custom Consulting Assignments, Databases & Subscription Platforms.


