
Poland Freight Brokerage Services Market Size and Share
Market Overview
| Study Period | 2020 - 2031 |
|---|---|
| Forecast Data Period | 2026 - 2031 |
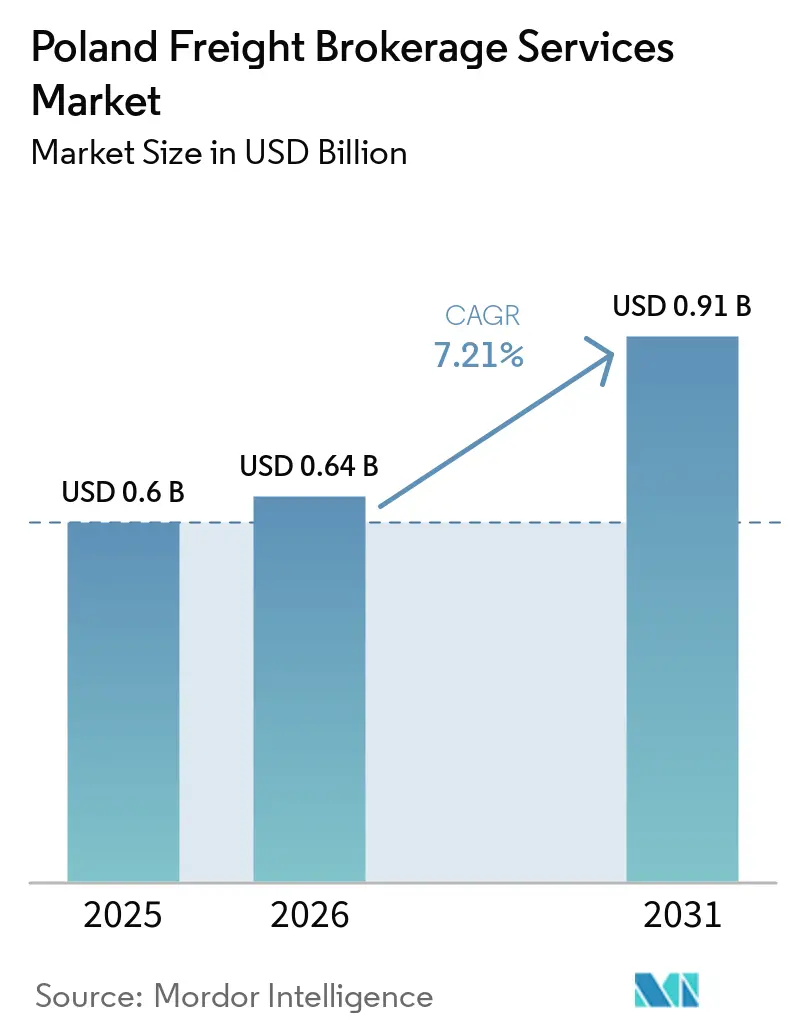
| Base Year Market Size (2025) | USD 0.6 Billion |
| Market Size (2026) | USD 0.64 Billion |
| Market Size (2031) | USD 0.91 Billion |
| Growth Rate (2026 - 2031) | 7.21% CAGR |
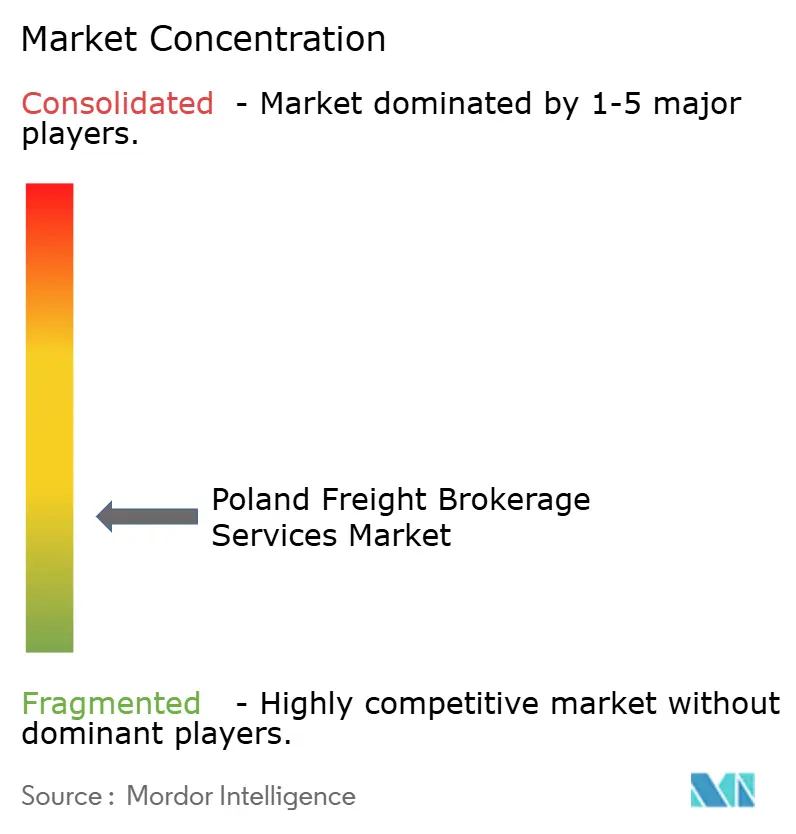
| Market Concentration | Low |
Major Players *Disclaimer: Major Players sorted in no particular order Image © ����������. Reuse requires attribution under CC BY 4.0. | |
Poland Freight Brokerage Services Market Analysis by ����������
The Poland freight brokerage services market size is projected to expand from USD 0.60 billion in 2025 and USD 0.64 billion in 2026 to USD 0.91 billion by 2031, registering a 7.21% CAGR between 2026 and 2031.
Persistent cross-border demand, Poland’s 43.4% share of EU cabotage operations, and containerized throughput growth of 9.7% at the Port of Gdansk in 2024 underpin the upward trajectory. Digital platforms accelerate disruption as AI-driven dynamic-pricing engines lift margins while e-CMR adoption trims administrative costs. Cold-chain mandates, e-commerce order fragmentation, and low-carbon procurement policies unlock specialized, higher-margin niches, even as a 30,000-driver shortage and port-side bottlenecks strain capacity. Consolidation among mega-brokers such as DSV and Sennder creates scale efficiencies, yet a long tail of financially fragile carriers maintains market fragmentation.
Key Report Takeaways
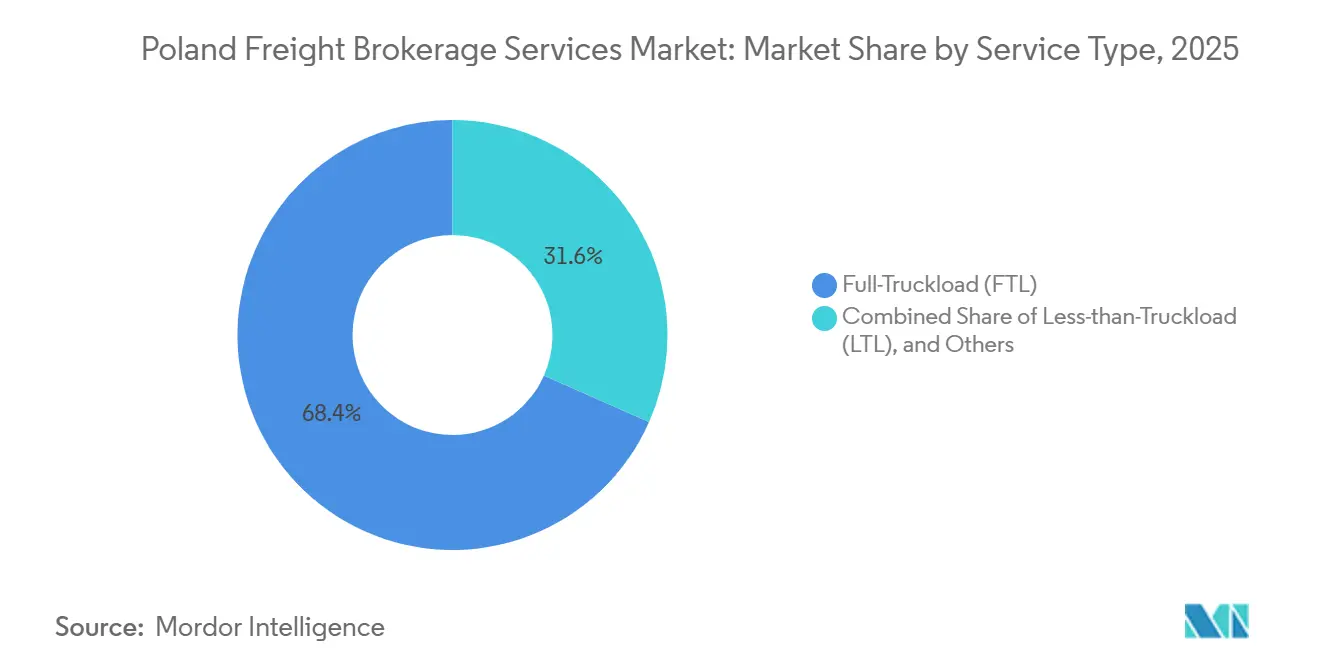
- By service, full-truckload led with 68.36% of the Poland freight brokerage services market share in 2025, while less-than-truckload is forecast to expand at an 8.97% CAGR through 2031.
- By equipment, dry vans accounted for 42.32% of the Poland freight brokerage services market size in 2025 and refrigerated vans are advancing at a 9.18% CAGR through 2031.
- By haul length, long-haul services held 57.95% of the Poland freight brokerage services market size in 2025; local hauls under 100 miles are projected to grow at an 11.20% CAGR up to 2031.
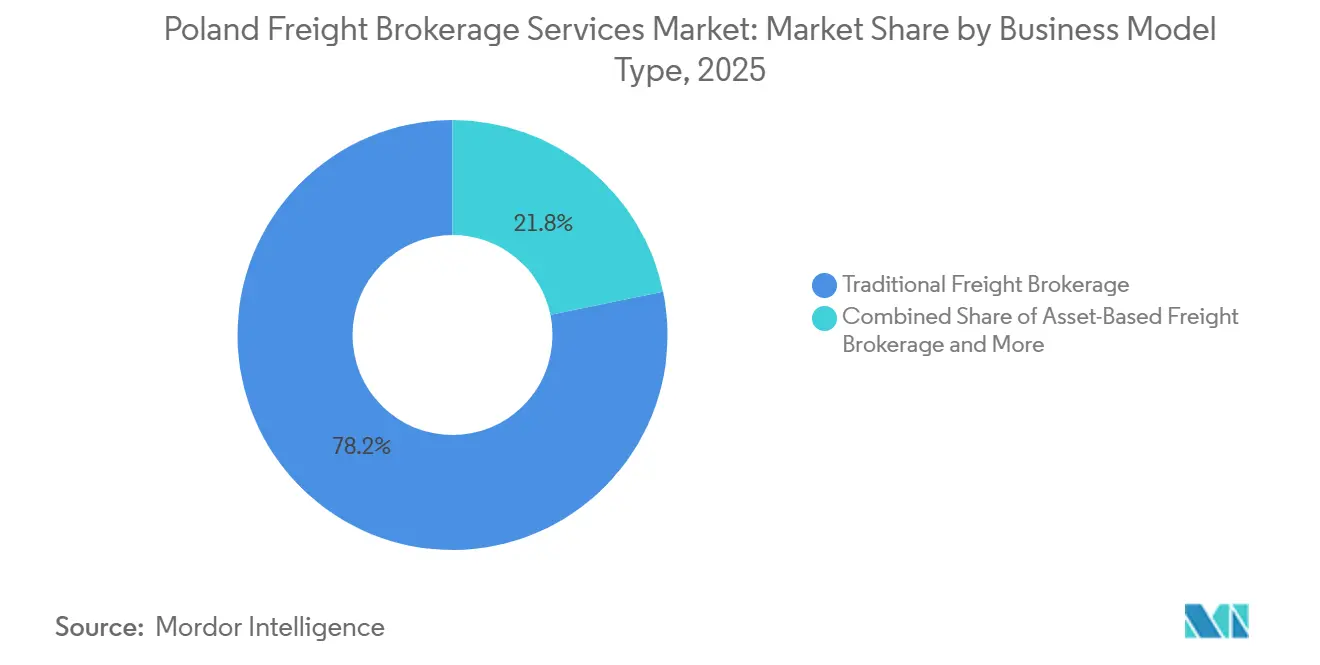
- By business model, traditional brokerage commanded 78.23% share of the Poland freight brokerage services market in 2025, while digital platforms record the highest projected CAGR at 20.93% to 2031.
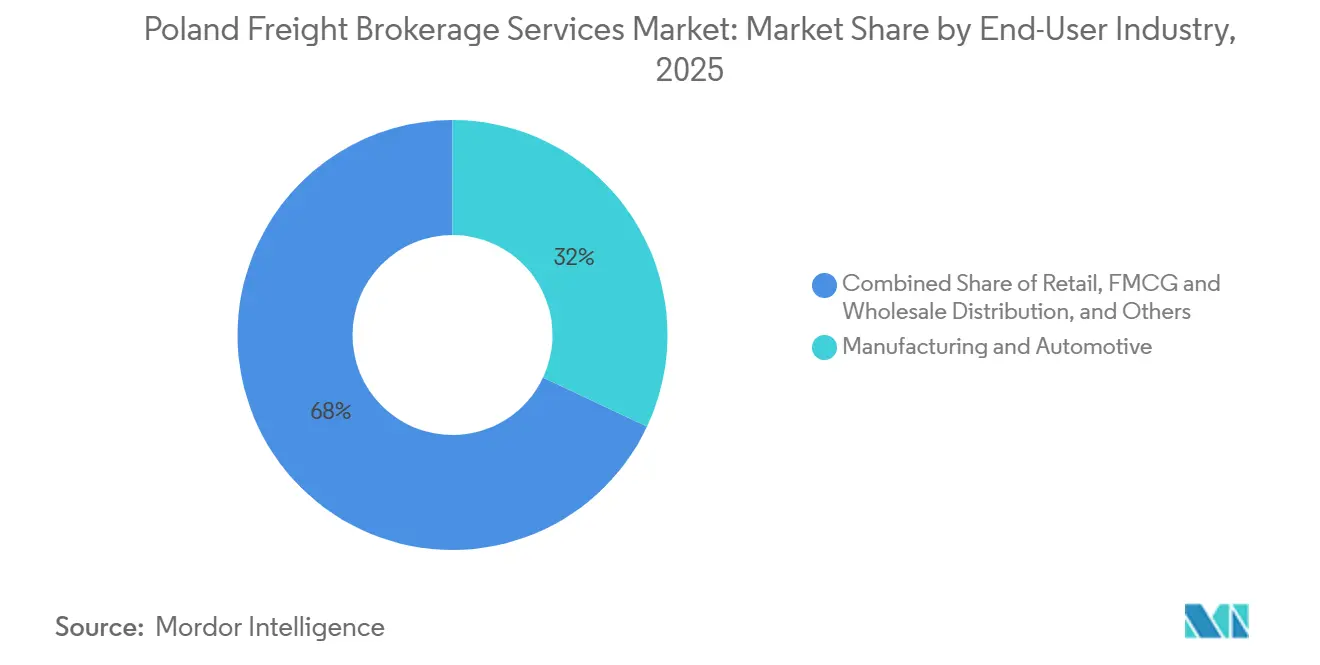
- By end-user, manufacturing and automotive captured 32.00% of demand in 2025; e-commerce and 3PL fulfillment are set to post a 17.93% CAGR through 2031.
- By customer size, large enterprises retained 62.09% share of the Poland freight brokerage services market size in 2025, whereas small businesses are expanding at a 13.87% CAGR over 2026-2031.
Note: Market size and forecast figures in this report are generated using ����������’s proprietary estimation framework, updated with the latest available data and insights as of January 2026.
Figures recorded within Poland feed into a worldwide estimate while studying the global industry. ����������'s freight brokerage services market size captures this aggregation.
Poland Freight Brokerage Services Market Trends and Insights
Drivers Impact Analysis*
| Driver | (~) % Impact on CAGR Forecast | Geographic Relevance | Impact Timeline |
|---|---|---|---|
| Mandatory e-CMR rollout accelerating digital document workflows | +1.3% | National, cross-border EU corridors | Short term (≤ 2 years) |
| Temperature-controlled pharma export surge under 2025 EU GMP rules | +1.1% | National, concentrated in pharmaceutical production hubs | Medium term (2-4 years) |
| Rapid expansion of EV-oriented automotive supply chains needing time-definite brokerage | +1.0% | Southern Poland automotive clusters, Western border regions | Medium term (2-4 years) |
| Corporate procurement of low-carbon transport (bio-LNG / e-truck) boosting green brokerage demand | +0.9% | National, early adoption in major metropolitan areas | Long term (≥ 4 years) |
| AI-driven dynamic-pricing engines unlocking premium for capacity optimization | +1.2% | National, platform-enabled brokers | Short term (≤ 2 years) |
| Growth of Poland-based same-day fulfillment hubs creating micro-freight lanes | +1.4% | Warsaw, Krakow, Poznan, Gdansk metropolitan areas | Short term (≤ 2 years) |
| Source: ���������� | |||
Mandatory E-CMR Rollout Accelerating Digital Document Workflows
Poland’s adoption of electronic consignment notes eliminates paper friction, trimming processing time by up to 40% and giving brokers real-time shipment visibility[1]“A Record-Breaking Year for Polish Seaports,” Trade.gov.pl, trade.gov.pl. The European Commission mandate for digital transport documents by 2026 hastens platform integration, allowing automated invoice reconciliation that cuts back-office costs by roughly 7%. Alignment with Poland’s KSeF 2.0 e-invoicing system effective February 2026 creates compliance synergies, especially for SME brokers without legacy IT. While some carriers face onboarding hurdles, early adopters enjoy faster proof-of-delivery cycles and reduced dispute times. Partial cross-border recognition still obliges hybrid workflows, yet EU harmonization is progressing.
Temperature-Controlled Pharma Export Surge Under 2025 EU GMP Rules
Revised GMP guidelines require continuous temperature monitoring, boosting demand for GDP-certified brokerage. Raben’s Fresh Logistics fleet of 550 refrigerated vehicles illustrates capacity expansion, now adding electric semi-trailers that slash CO₂ and fuel use by 30%. Brokers securing validated cold-chain solutions command 15-25% pricing premiums. IoT sensors and blockchain logging reduce cargo insurance outlays by up to 15% through verifiable audit trails. However, specialized equipment scarcity keeps barriers high for SMEs, widening segmentation opportunities.
Rapid Expansion of EV-Oriented Automotive Supply Chains Needing Time-Definite Brokerage
Battery factories near Wrocław and new semiconductor lines are tightening just-in-time delivery windows; assembly stoppages can cost EUR 10,000-20,000 (~USD 11,760-23,526) per hour. Brokers offering guaranteed 30-minute delivery tolerances earn 20-30% premiums. GPS-enabled trailers with predictive ETA algorithms now lift on-time performance from 85% to more than 92%. Yet a 30,000-driver gap imposes capacity buffers and higher operational costs. Platforms counter with AI route optimization that factors border delays and hours-of-service[2]Trans.eu, “Cennik Trans.eu | Platforma Trans.eu,” trans.eu .
Corporate Procurement of Low-Carbon Transport Boosting Green Brokerage Demand
Shippers’ ESG policies prioritize bio-LNG and e-trucks even though alternative-fuel capacity is below 3% of Poland’s fleet. Raben targets 10% alternative vehicles this year, climbing to 75% within five years. Brokers able to guarantee low-carbon capacity apply 8-12% surcharges, leveraging carbon accounting tools such as EcoTransIT for Scope 3 reporting. Range limits keep e-trucks on regional lanes, but bio-LNG’s corridor build-out advances steadily.
Restraints Impact Analysis*
| Restraint | (~) % Impact on CAGR Forecast | Geographic Relevance | Impact Timeline |
|---|---|---|---|
| CBAM compliance costs increasing cross-border brokerage complexity | –0.9% | EU cross-border, carbon-intensive trade lanes | Medium term (2-4 years) |
| Hinterland congestion from capacity bottlenecks at Gdansk and Gdynia ports | –0.7% | Baltic coastal regions, inland corridors | Short term (≤ 2 years) |
| Escalating cyber-attacks on digital freight platforms undermining shipper trust | –0.5% | National, platform brokers | Short term (≤ 2 years) |
| Fragmented third-party warehousing limiting end-to-end visibility | –0.6% | National multimodal corridors | Medium term (2-4 years) |
| Source: ���������� | |||
CBAM Compliance Costs Increasing Cross-Border Brokerage Complexity
The full CBAM rollout in 2026 obliges brokers to track embedded emissions and secure carbon certificates, thereby inflating cross-border processing costs by 3-5%. Implementation budgets range from EUR 50,000 to EUR 200,000 (USD 58,815 to USD 235,262), stretching SME resources. Carbon price volatility, projected to reach EUR 100 per tonne by 2030, compels the insertion of surcharge clauses into contracts. Digital platforms are adding compliance modules, but interoperability issues persist.
Hinterland Congestion from Capacity Bottlenecks at Gdansk and Gdynia Ports
Gdansk handled 2.25 million TEU in 2024, yet rail and road links lag, spawning truck queues of up to four hours. Intermodal terminals operate above optimal utilization, and even an EUR 1.4 billion (USD 1.64 billion) rail upgrade has not closed the gap. Brokers must build costly buffer stock or negotiate off-peak pickups, eroding margins on time-sensitive cargo[3]“Rosyjskie Porty z Największym Wzrostem Przeładunków na Bałtyku,” Trojmiasto.pl, trojmiasto.pl.
*Our forecasts treat driver/restraint impacts as directional, not additive. The impact forecasts reflect baseline growth, mix effects, and variable interactions.
Segment Analysis
By Service: Demand Polarization Between FTL Scale and LTL Flexibility
Full-truckload commanded 68.36% market share of the Poland freight brokerage services market in 2025, sustained by high-volume lanes connecting Baltic ports with Western Europe. The Poland freight brokerage services market size for full-truckload is expected to rise steadily, though at a slower pace than niche segments as digital consolidation brings efficiency gains. Large enterprise shippers rely on contract lanes for predictability, preserving FTL’s dominance even as smaller carriers exit under financial strain[4]“10 Najpopularniejszych Giełd Transportowych, 2024,” E-transport.pl, e-transport.pl.
Less-than-truckload, while smaller, is projected to post an 8.97% CAGR, propelled by e-commerce order fragmentation and SME shippers seeking pallet-level flexibility. Digital consolidation engines embedded in platforms such as Trans.eu improve trailer utilization to 85%, allowing rate discounts and expanding the Poland freight brokerage services market addressable to businesses previously priced out of LTL. Specialized “other” services oversized loads and hazardous cargo retain premium pricing, cushioning brokers against cyclical softness in general freight.


By Equipment Type: Cold-Chain Assets Drive Above-Trend Growth
Dry vans, the workhorses of consumer goods and automotive flows, held 42.32% market share in 2025 and remain the baseline capacity pool. However, refrigerated vans grow at 9.18% CAGR, expanding the Poland freight brokerage services market size for temperature-controlled lanes as pharma GMP and grocery retail tighten compliance expectations. Tankers and flatbeds benefit from infrastructure outlays and chemical exports but face slower replacement cycles.
Innovation accelerates; electric reefers trialed by Raben capture shipper attention by slicing CO₂ footprints 30% and aligning with ESG scorecards. Equipment scarcity lets brokers levy capacity premiums during peak harvests when cold-chain demand can jump 60%, preserving margins despite rising powertrain costs.
By Haul Length: Urban Micro-Lanes Erode Long-Haul Exclusivity
Long-haul traffic still dominates with 57.95% of the Poland freight brokerage services market size in 2025, fed by steady Baltic-to-Benelux corridors. Yet urban micro-lanes under 100 miles are accelerating at 11.20% CAGR as same-day fulfillment becomes a retail norm.
DHL’s new EUR 180 million (USD 211.73 million) Poznan hub exemplifies the warehouse density enabling 30-km delivery radiuses that depend on rapid brokerage matching. Higher per-kilometer costs are offset by 20-25% pricing premiums, and AI route-sequencing drives 15% better driver productivity. Regional hauls fill the service continuum, supporting domestic distribution among Poland’s tier-two cities.
By Business Model: Platforms Capture Volume, Hybrids Capture Trust
Traditional brokers still accounted for 78.23% of the Poland freight brokerage services market share in 2025, buttressed by legacy contracts and credit provision. Digital platforms, however, are advancing at 20.93% CAGR, democratizing access for SMEs through subscription models as low as €129 per month and adding roughly 4,000 shippers annually.
Hybrid consolidation, as shown by Sennder’s EUR 1.4 billion (USD 1.64 billion) purchase of C.H. Robinson’s EU operations, blends tech scalability with human expertise, appealing to enterprise accounts needing white-glove service. Asset-based brokers leverage owned fleets to guarantee holiday-peak capacity, while agent models expand regionally without heavy capital commitments.
By End-User Industry: E-Commerce and 3PL Fulfillment Sprint Ahead
Manufacturing and automotive maintained 32.00% market share in 2025, evidence of Poland’s role in European vehicle and component supply chains. Nonetheless, e-commerce and 3PL fulfillment will pace the Poland freight brokerage services market with a 17.93% CAGR through 2031, underpinned by online retail projected to hit PLN 192 billion (USD 53.43 million) by 2028.
Healthcare and pharma require GDP compliance, supporting growth in specialized cold-chain brokerage. Construction freight benefits from rail and road megaprojects, while agriculture exports feed reefer lanes. Integrated brokers capable of serving multiple verticals diversify risk across cycles.
By Customer Size: SMEs Gain Bargaining Power Through Platforms
Large enterprises held 62.09% market share in 2025 thanks to volume contracts, yet small businesses below USD 10 million revenue are forecast to post a 13.87% CAGR. The Poland freight brokerage services industry’s digital democratization lets SMEs avoid legacy minimums and tap real-time market rates.
Carrier bankruptcies 120 in Q1 2024 alone magnify the need for broker payment guarantees, making platforms that escrow funds attractive to smaller shippers. Mid-market firms remain a balanced opportunity, valuing both relationship and automation.
Geography Analysis
Poland’s domestic freight flows cluster around Warsaw, Krakow, Poznan, and Gdansk, where warehouse inventories exceed 31.7 million m² and intermodal nodes enable multimodal choice. Southern automotive hubs near Wrocław demand time-definite coordination, while Baltic gateways funnel import containers inland, expanding the Poland freight brokerage services market.
Western border crossings grapple with German toll hikes topping 80%, prompting brokers to introduce dynamic surcharges and reroute via Czech corridors when economics warrant. Eastern regions leverage PLN 2.4 billion (USD 667.94 million) road upgrades and EUR 450 million (USD 529.33 million) EIB rail financing, enhancing access to new EU markets. Nonetheless, hinterland congestion at Gdańsk drives average yard dwell to four hours in peak season, pressuring just-in-time cargo schedules.
Driver shortages skew most severe in Lower Silesia, and recruiters increasingly draw from Central Asia. Technology penetration rises fastest in Warsaw and Poznan, where high-density freight allows platform algorithms to maximize lane matching, adding resilience to the Poland freight brokerage services market.
���������� evaluates the freight brokerage services market across all key regional markets, including Europe and North America, with deeper country-level insights covering Germany, Spain, Canada, Russia, Mexico, Spain, and Netherlands.
Competitive Landscape
Despite headline mega-mergers, the Poland freight brokerage services market stays fragmented across thousands of carriers. DSV’s EUR 14.3 billion (USD 15.8 billion) integration of DB Schenker and Sennder’s EUR 1.4 billion (USD 1.64 billion) roll-up of C.H. Robinson’s EU surface unit elevate the top tier, but 17% AI adoption and 43,000 platform-verified carriers keep price pressure alive.
Platform rivalry hinges on liquidity: Clicktrans’ 37,000-carrier base and Trans.eu’s 25,000 carriers build reinforcing network effects. Traditional brokers double down on value-addcustoms clearance, cargo insurance, and control-tower consulting to retain enterprise wallets. Specialized niches such as GDP-pharma, low-carbon lanes, and EV battery moves offer outsized margins for certified operators.
Carrier insolvencies and debt totaling PLN 1.4 billion (USD 389.63 million) in 2024 invite acquisition at distressed valuations, giving well-capitalized brokers fleet assets without ground-up investment. Cyber-security resilience differentiates platforms post-GDPR and DORA legislation, with some shippers reverting to private networks after ransomware scares.
Poland Freight Brokerage Services Industry Leaders
C.H. Robinson
Sennder
Emo Trans
DHL Group
DSV A/S
- *Disclaimer: Major Players sorted in no particular order

Recent Industry Developments
- April 2026: Rhenus Warehousing Solutions Poland unveiled an automated AutoStore system at its Bolesławiec warehouse, aiming to enhance order fulfillment for its e-commerce, fashion, and lifestyle clientele. This cube-based storage solution, spanning 20,000 sqm, manages over 100,000 bins, reducing picking times by 40% and supporting a peak-season throughput of over 1 million picks monthly.
- September 2025: Rhenus Group completed the rebranding of its 2021 acquisition, C. Hartwig Gdynia S.A., to Rhenus Air & Ocean Poland S.A. This move integrates various cargo services into Rhenus's global network, expanding its presence in Eastern Europe from nine Polish sites.
- February 2025: Sennder finalized its EUR 1.4 billion (USD 1.64 billion) acquisition of C.H. Robinson’s European surface operations, creating a top-five FTL operator.
- January 2025: Kuehne+Nagel opened a 6,000 m² Chorzow fulfillment center, expanding to 27 Polish sites with real-time myKN inventory visibility.


Poland Freight Brokerage Services Market Report Scope
| Full-Truckload (FTL) |
| Less-than-Truckload (LTL) |
| Others |
| Dry Van |
| Refrigerated Van |
| Flatbed / Step-Deck |
| Tanker (Bulk Liquid and Chemical) |
| Others |
| Long-Haul (More than 500 miles) |
| Regional (100-500 miles) |
| Local (Less than 100 miles) |
| Traditional Freight Brokerage |
| Asset-Based Freight Brokerage |
| Agent Model Freight Brokerage |
| Digital Freight Brokerage |
| Manufacturing and Automotive |
| Construction and Infrastructure Projects |
| Oil, Gas, Mining and Chemicals |
| Agriculture and Food / Beverage |
| Retail, FMCG and Wholesale Distribution |
| Healthcare and Pharmaceuticals |
| E-commerce and 3PL Fulfilment |
| Other End-User Industry |
| Large Enterprise Shippers (More than USD 100 M) |
| Mid-Market Shippers (USD 10-100 M) |
| Small Businesses (Less than USD 10 M) |
| By Service | Full-Truckload (FTL) |
| Less-than-Truckload (LTL) | |
| Others | |
| By Equipment / Trailer Type | Dry Van |
| Refrigerated Van | |
| Flatbed / Step-Deck | |
| Tanker (Bulk Liquid and Chemical) | |
| Others | |
| By Haul Length | Long-Haul (More than 500 miles) |
| Regional (100-500 miles) | |
| Local (Less than 100 miles) | |
| By Business Model | Traditional Freight Brokerage |
| Asset-Based Freight Brokerage | |
| Agent Model Freight Brokerage | |
| Digital Freight Brokerage | |
| By End-User Industry | Manufacturing and Automotive |
| Construction and Infrastructure Projects | |
| Oil, Gas, Mining and Chemicals | |
| Agriculture and Food / Beverage | |
| Retail, FMCG and Wholesale Distribution | |
| Healthcare and Pharmaceuticals | |
| E-commerce and 3PL Fulfilment | |
| Other End-User Industry | |
| By Customer Size | Large Enterprise Shippers (More than USD 100 M) |
| Mid-Market Shippers (USD 10-100 M) | |
| Small Businesses (Less than USD 10 M) |


Key Questions Answered in the Report
How fast is digital brokerage growing in Poland freight brokerage services market?
Digital platforms are expanding at a 20.93% CAGR through 2031, the fastest of all business models.
Which haul length segment is gaining the most momentum?
Local deliveries under 100 miles are projected to grow at an 11.20% CAGR, nearly double the pace of long-haul lanes.
What drives demand for refrigerated equipment?
EU GMP rules and booming pharmaceutical exports push refrigerated van demand to a 9.18% CAGR, the highest among trailer types.
How big is e-commerce’s impact on Polish freight demand?
E-commerce and 3PL fulfillment is the fastest end-user group with a 17.93% CAGR, riding online retail’s march toward PLN 192 billion (~USD 52 billion) by 2028.
Why do brokers charge premiums for low-carbon transport?
Alternative-fuel trucks are under 3% of the fleet, so guaranteed green capacity commands 8-12% surcharges as shippers chase ESG goals.
What regulatory change will reshape brokerage paperwork?
Mandatory e-CMR and Poland’s KSeF 2.0 e-invoicing system from February 2026 will enforce fully digital documentation, slashing administrative friction.
Page last updated on:


